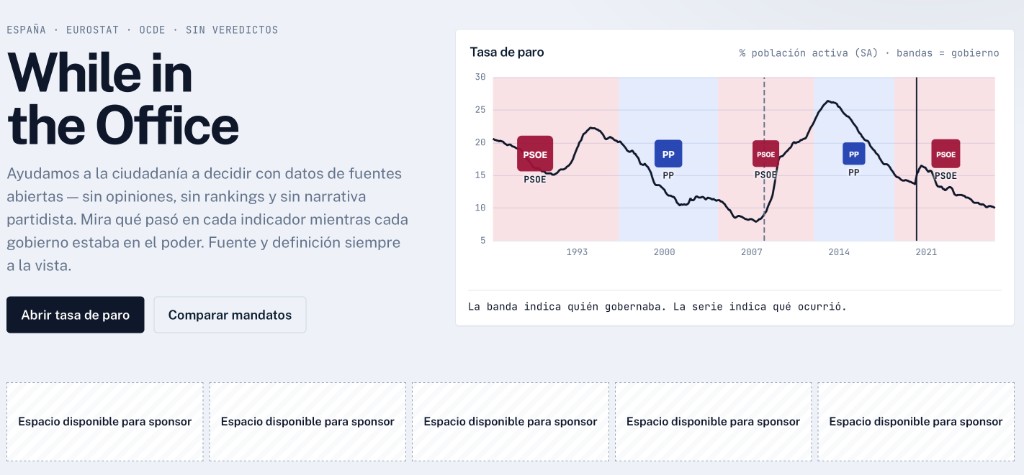
Resultados en el gobierno de Mariano Rajoy
Partido Popular (PP). 2011-12-21 → 2018-06-01. Valores al inicio y fin del mandato según series oficiales. No es un ranking ni implica causalidad.
| Indicador | Inicial | Final | Δ abs | Δ % |
|---|---|---|---|---|
| GDP per capita | 22240.00 | 25130.00 | 2890.00 | 13.0% |
| Unemployment rate | 22.90 | 15.20 | -7.70 | -33.6% |
| Life expectancy at birth | 82.50 | 83.10 | 0.60 | 0.7% |
| PISA | 484.00 | 481.00 | -3.00 | -0.6% |
| Early leavers from education | 24.70 | 17.90 | -6.80 | -27.5% |
| Healthy life years | 65.30 | 68.00 | 2.70 | 4.1% |
| House price index | 116.80 | 117.90 | 1.10 | 0.9% |
| Homicide rate | 0.77 | 0.62 | -0.15 | -19.5% |
| At risk of poverty or social exclusion | — | 27.30 | — | — |
| Net migration rate | -3.00 | 7.00 | 10.00 | 333.3% |
| Government debt / GDP | 89.60 | 99.80 | 10.20 | 11.4% |
Comparar legislaturas · uso libre de gráficos con atribución a While in the Office.